
Group Comparisons
Grouping Respondent Answers - Comparisons
LTCOVID.com
Thanks for visiting!
To translate this page, select your
language from the dropdown menu below:
"All Respondents" is of course the largest group.
The answers to the questionnaire and analyzed results for these first 136 participants have been presented.
Finding differences in the responses given, taking apart (and putting back together what was learned from the disassembly), is a traditional method for learning more.
What is the value of finding a difference that is "highly statistically significant" in a variable between two groups?
It helps us to see a difference where before we saw none. Sometimes these can be guessed ahead of time. But sometimes such a result leaves the investigatior stymied and incredulous. That's a good place to start from.
And if the topic relates to treating an illness, such a difference, once confirmed, may provide a window of opportunity in the pursuit of treatments and cures.
One must not forget that the negative result, finding no difference at all, and confirmed by tools that make it less likely that such a conclusion is actually a mistake, ... those results are very important as well. Perhaps less exciting than a 'new discovery' emerging from a previously unseen difference.
Finding that there is absolutely no difference in the rate of complications and side effects from administering a new vaccine to 2 different groups, is obviously important (and timely).
So lets do some comparing within our questionnaire's responses obtained.
A questionnaire of 59 questions.
And within those questions different possible choices of answers selected.
Age, gender, race, smoker or not, differences in body size, medications, physical and emotional status ...
Suddenly, a whole host of possible groupings, the "haves" and the "have nots" comes to mind.
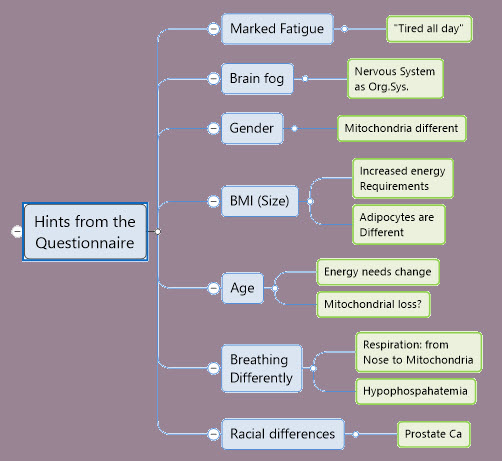
Here's how we approached that.
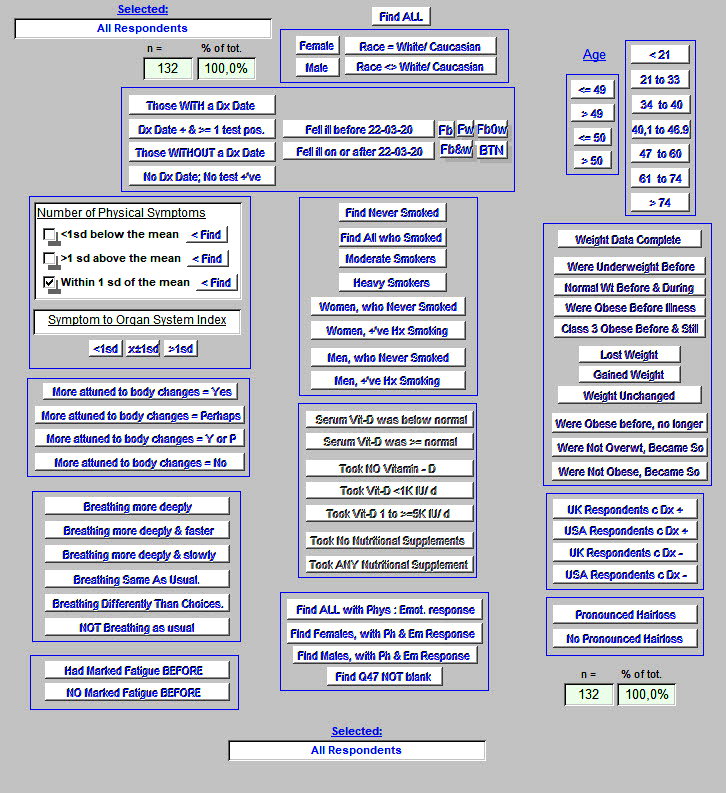
Here's a larger view of the upper portion of the above ...
Each click on one of these selected buttons, provides the mean values for 57 variables in the group selected.
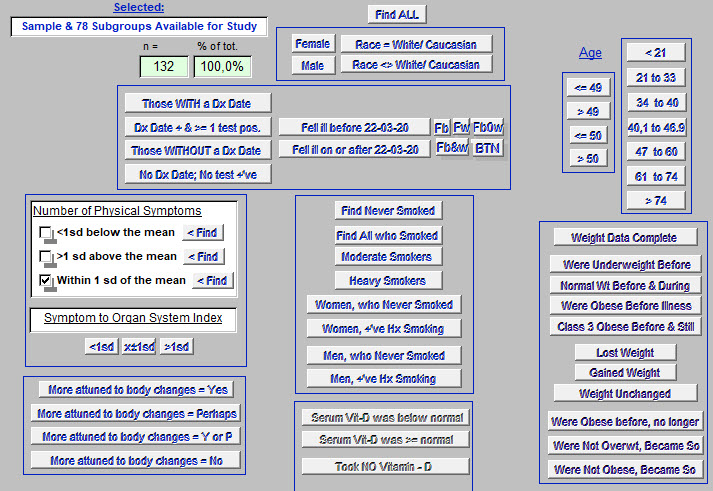
One sees 78 subgroups, each responding to 57 variables that come directly out of the survey's 59 questions (the last 2 were written responses, advice to patients and advice to medical teams, already presented).
So for example, did smokers (increased above the number found in the population), have more sympotms than non-smokers? What about their differences in age, in weight, or duration of illness?
All respondents, by answering, self-dentified as having "long-term" COVID-19.
There was no control group of healthy volunteers.
Let's look at several of these comparisons listed above.
Let's look for possibly different results arising in various groupings of :
-
-
- Gender
- Race
- Age
-
- Those are pretty usual headings or subgroupings. But what results will become more apparent, if the larger sample is divided into less usual groups? Such division is not random. It is suggested by the overall results.
-
- Those who had Marked Fatigue BEFORE becoming ill with the virus, compared with those who did not usually suffer fatigue. Vitally important to our journey towards a conclusion.
- Those who reported a number of symptoms 1 standard deviation ABOVE the mean (or average) number reported by all respondents, and 1 std. deviation BELOW that overall mean value.
-
Why pursue these last two?
-
-
- Fatigue is a frequent reported symptom to be found in the answers. But some respondents had this (and often other symptoms) BEFORE becoming ill. If they are still fatigued, why is that? "Same as usual," or someting new? Or something superimposed on the pre-existant fatigue, and worsening it?
- Symptoms abound in number in this group of patients. We learned and confirmed that. If one divides the respondents into a group with very many symptoms, and another with many fewer symtoms than most, ... What can be learned about how symptom number relates to the 56 other variables? Perhaps having more or fewer symptoms due to this viral illness would make no difference. That doesn't seem medically logical. While which symptoms a patient presents with is key to making a diagnosis. If the patient presents with few, the rest often need to be patiently ellicited. But at first pass here, we'll try to learn what the number of symptoms has to teach.
-
"Who says there's a difference?"
Many questionnaires aim at thousands of responses. Product marketing surveys come to mind.
What sells better? The blue or the yellow ice cube trays. Before having them manufactured, let's make just two and show them to 10 000 people and see which one they pick.
So if we have obtained at present, only 136 responses, is that enough? Enough to find important differences where they exist?
Fortunately, small group statistical methods come to the rescue. And without further pushing a proof of that hypothesis on you kind reader, we'll see below how use of such tools played out.
In what follows, results are sorted by those most statistically significant at the top, down to no differences found between subgroups, at the bottom.
GENDER DIFFERENCES
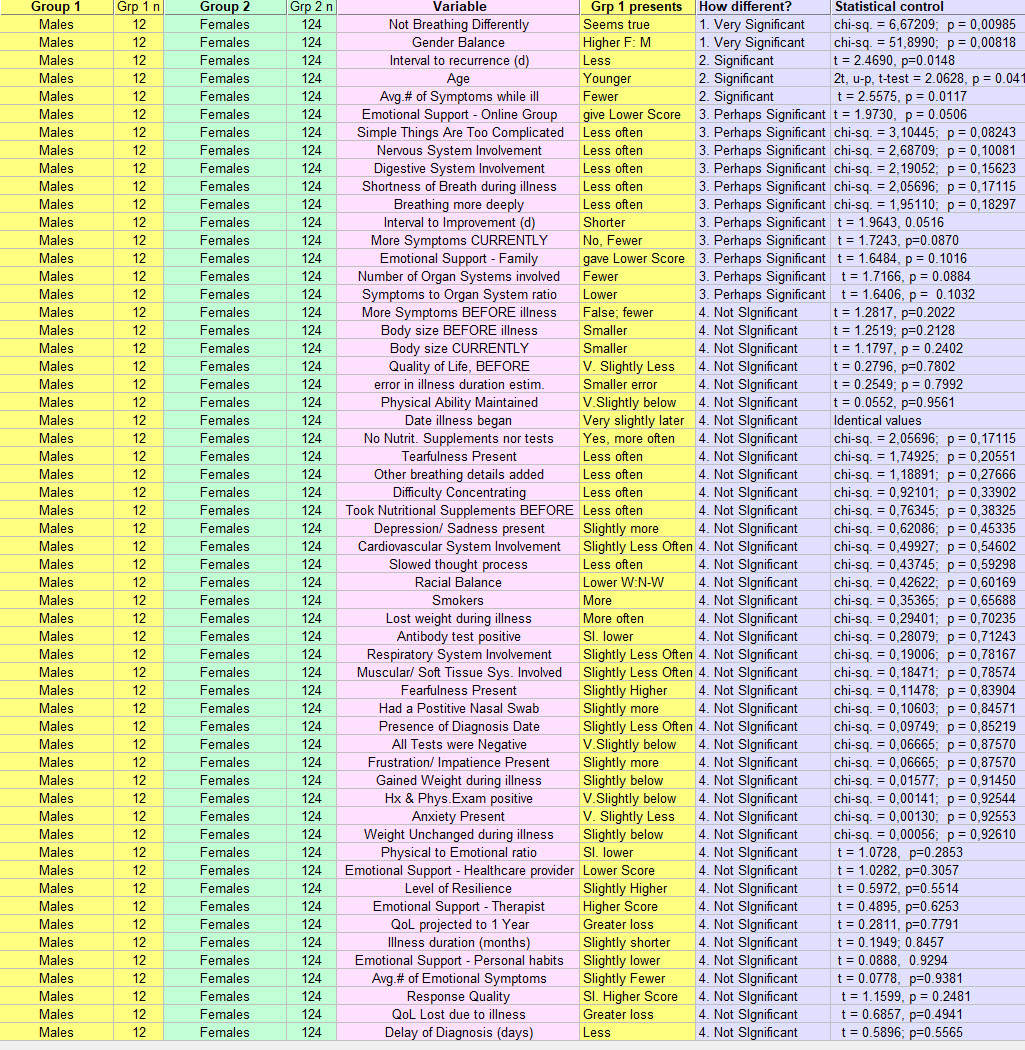
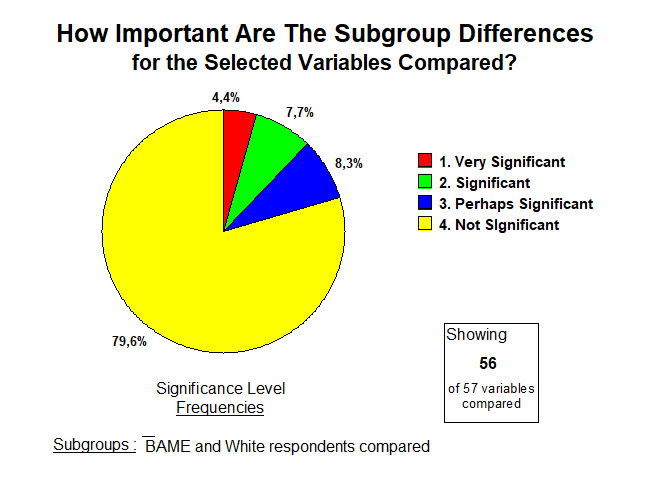
For these 57 variables compared, how important were the differences found in these between men and women?
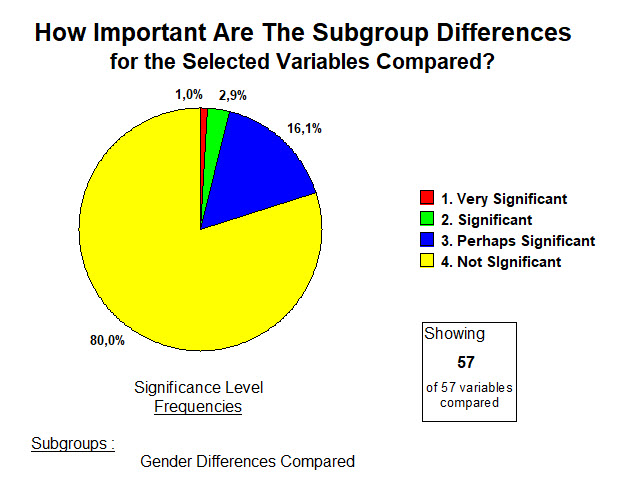
The illness "behaved" similarly in men and women, 80% of the time. Yet women present with it much more often.
And for the 20% where statistical methods found a difference, for Men (Grp 1), where should one direct one's attention? (These below, taken from the top of the above list). And if these are mathematically different from the results for female respondents, are they clinically important? And to be pursued how?
The scond line below shows how naive the process can be. It confirms a very significantly greater number of Females than Males. We knew that. But clearly, that should not be too quickly dismissed.
Once we know a thing, we at times accept it too quickly as normal. As just the way it is.
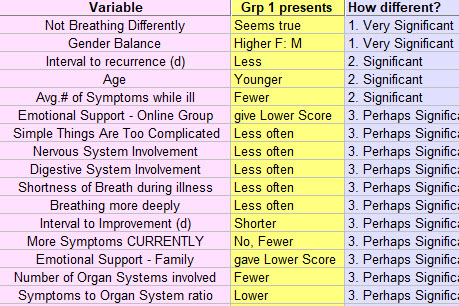
But the above results seem to point towards a less severe "long-term" COVID-19 illness in men than for the women.
----------
AGE DIFFERENCES
Group 1 older than 50 years and Group 2, 50 or less.
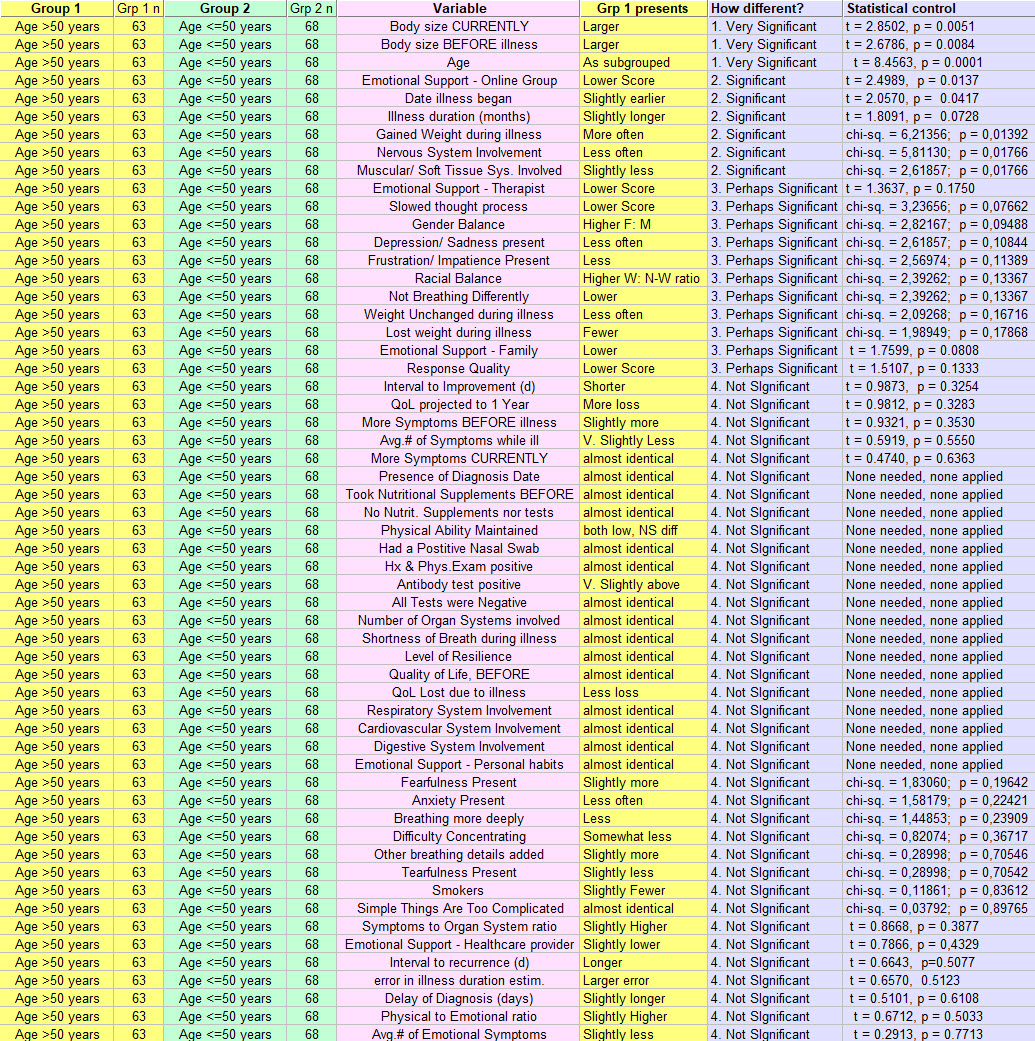
For these 57 variables compared, how important were the differences found in these, between those older and younger?
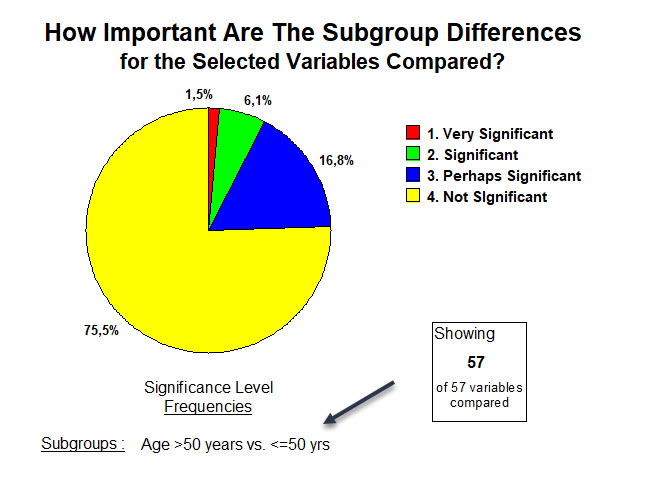
Some increase in "important" findings for Age, when compared with effects of Gender differences.
Here is the "top of the list" for those who are older (Grp 1) and presenting with "long-term" COVID-19:
(Again, the significant age difference result is one we created, by grouping them into 2 groups).
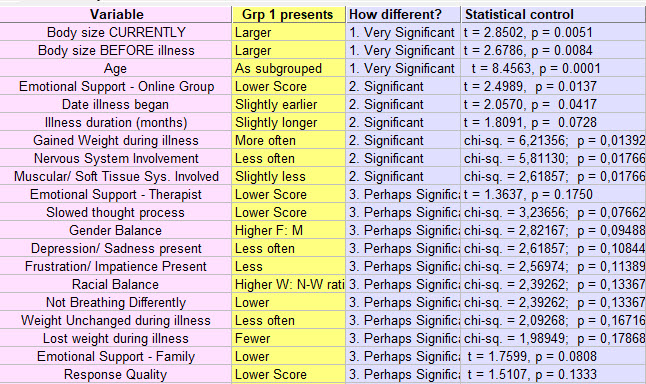
A clear difference between these older respondents and the younger, is that they gained weight and were larger to begin with. They had been sick a little longer, and their illness began earlier.
Most of these differences are lower values than in the younger group.
But the strongest statement once again, seems to be that there were no significant differences in this illness based on a "cutoff" in age at 50 years. 76% of results are "No difference."
Of course, older members of the population who were perhaps sicker and hospitalized in an ICU, (our respondents mostly had a "moderate illness"), did not take this questionnaire at that time. That may not be important at all in defining this "long-term" variant of the COVID-19 illness as it is currently presenting in the majority.
Here is a link to The Severity of Illness question (#28) and its results. But the point is that for those with "long-term" COVID-19 who were older, and responded to our survey, age per se made less impact on severity of illness and outcomes. That too is telling us something about this variant of the COVID-19 illness.
--------------
DIFFERENCES LINKED TO RACE
Group 1 = BAME, (Black, Asian, minority-ethnic) & Group 2 = White/ Caucasian
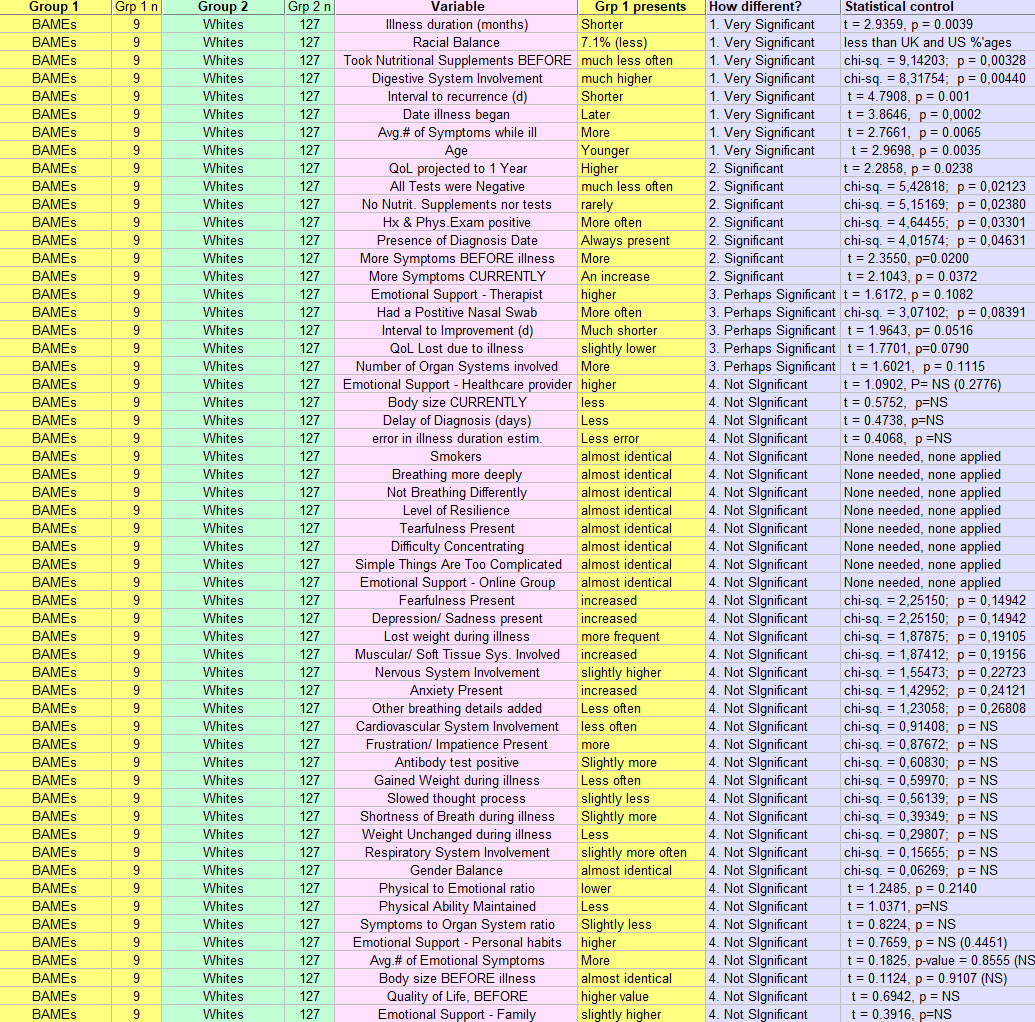
For these 57 variables compared, how important were the differences found in these, between those BAME and Whites?
Once again, a distribution of frequencies of result significance that's starting to look familiar.
BAME (Grp 1) at the "significant" end of the spectrum for these variables, as below:
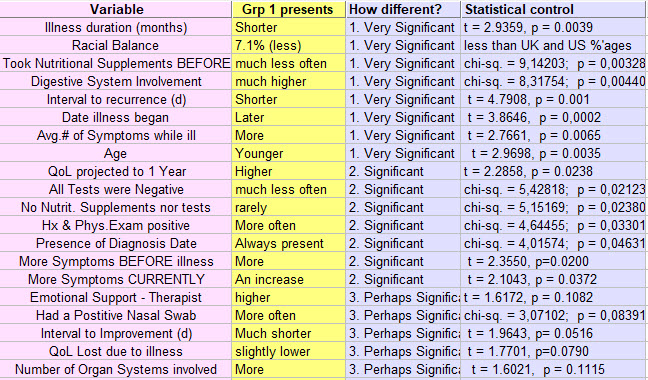
Some interesting findings emerge from the BAME respondents even if relatively few in number.
Again the "small group" tools let us make pronouncements with a bit more confidence.
Some differences observed remind us to mention that some of these differences found in variations in race or ethnicity, may precede this viral illness. They may nevertheless come along for the "L-t" COVID-19 journey.
For example, from above: more Digestive System involvement than in whites. A study of American Blacks had found 4 times higher incidence of Helicobacter pylori (bacterium associated with ulcer disease), than in whites.
One finds other lines above, that speak to the presence of more disease in the BAME respondents, and again, the medical literature supports this. It is too often overlooked. Though younger, these respondents have more symptoms, already before the illness and on the day responding to the survey. More organ systems involved. Less use of nutritional supplements.
We can also find a shorter interval before improvement of the illness. Also more hopefulness expressed when projecting Quality of Life one year from now. Perhaps the two are related.
These findings do not speak to the BAME population outside the "long-term" COVID-19 theatre.
Yet clearly, this ilness takes place in the setting of one's health before becoming infected with the virus.
----------
What do the grouped responses to the questionnaire tell us about fatigue, a fairly universal symptom in this group of respondents (and in the related literature)?
But some had this symptom BEFORE becoming ill with the virus. What difference might that make?
FATIGUE : BEFORE & NOT
Group 1 = Marked Fatigue BEFORE & Group 2 = No Marked Fatigue Before
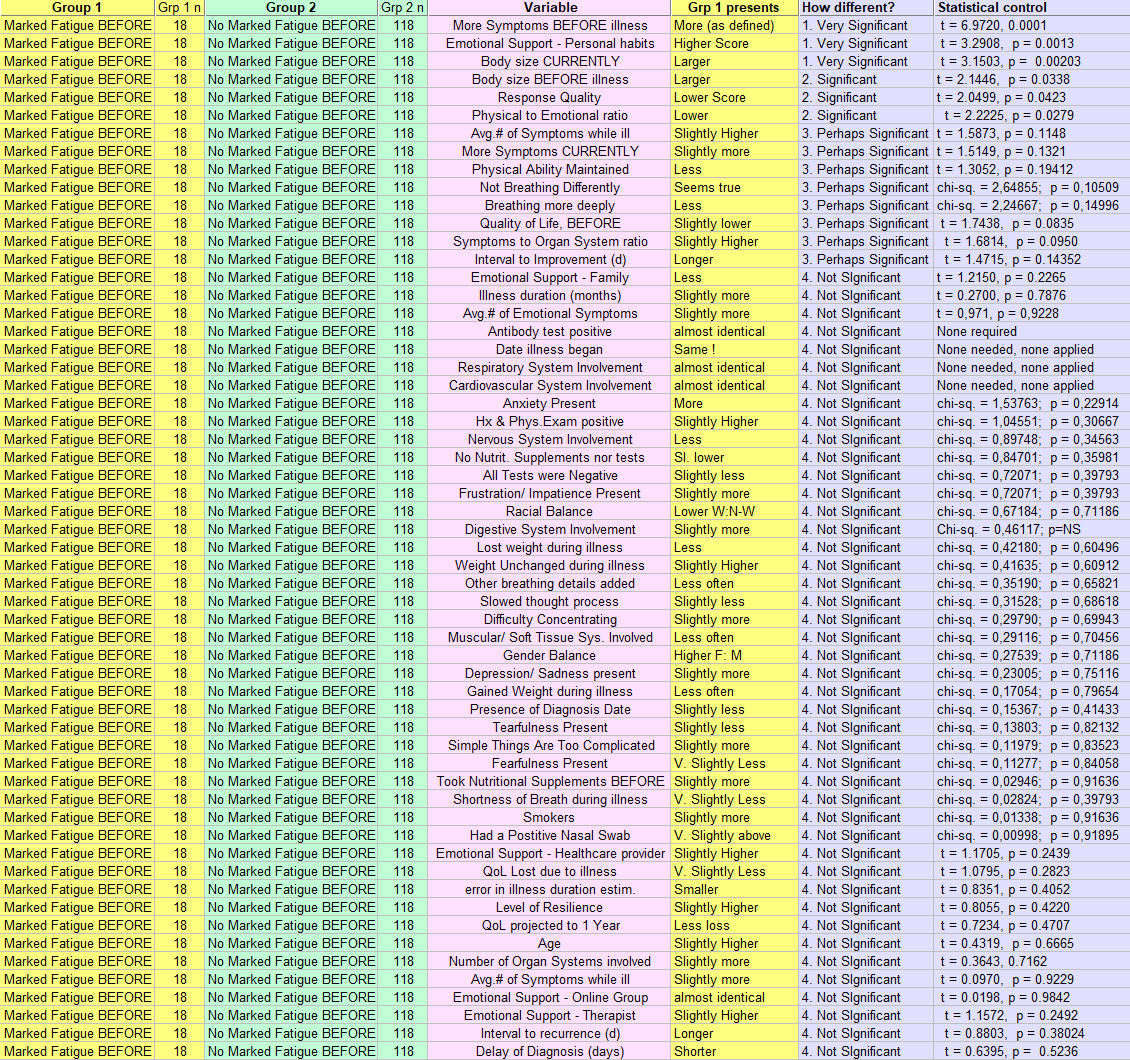
In quickly scanning the bluish columns, one notices that most comparisons for these 57 variables, yield differences that are not significant.
Distribution of significance frequencies?
Pretty much as just suggested.
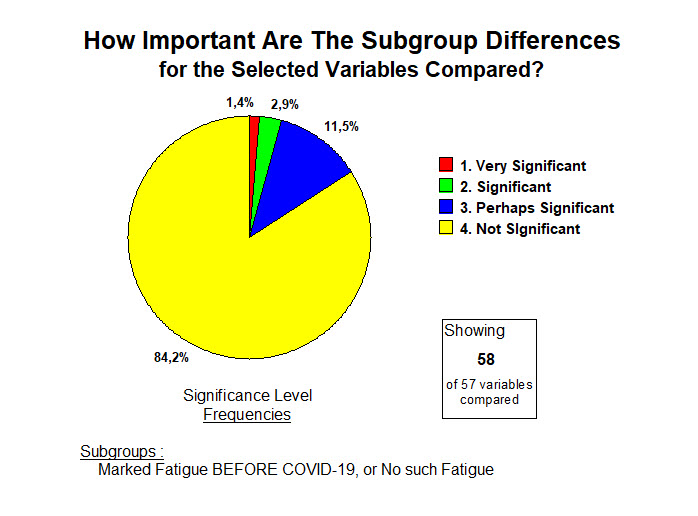
But there are some important differences ...
More Fatigue Before (Grp 1):
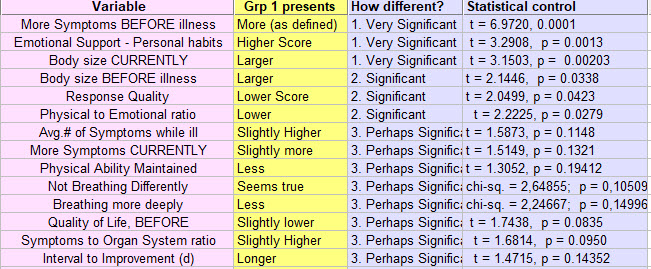
One gets a sense that whatever the Grp 1 respondents here brought to this illness from before its onset, those things did not help make this illness pass more easily. More symptoms per each organ system seems translated nevertheless into a response that is more emotional than physical compared with Grp 2. And to find help, this Grp 1 turns mostly to personal habits and practices.
Yet the majority finding is that for most of the 57 variables that were explored by the questionnaire, this fatigue present before or not, made little difference.
Yet where the differences appear in the list above, they may make a critical difference in outcome from this illness.
Imagine a conversation at the doctor's office.
The information just provided should contribute the facts for changing a patient's behavior.
"If you have (X, Y or Z - you can chose from the lists above) you are at increased risk for having this "long-term" variant of the COVID-19 illness, should you get it. Perhaps we can work on that, and decrease your risks for being ill for a long time."
Ahhh ... applied research.
------------
And finally ....
DIFFERENCES LINKED TO NUMBER OF SYMPTOMS
Group 1 = a number of reported symptoms that is 1 standard deviation ABOVE the mean, and
Group 2 = the numeber of reported symptoms is 1 standard deviation BELOW the mean or average number of symptoms during this illness. and "during" actually means: Early, During, Currently in the illness course.
Here is their long list :
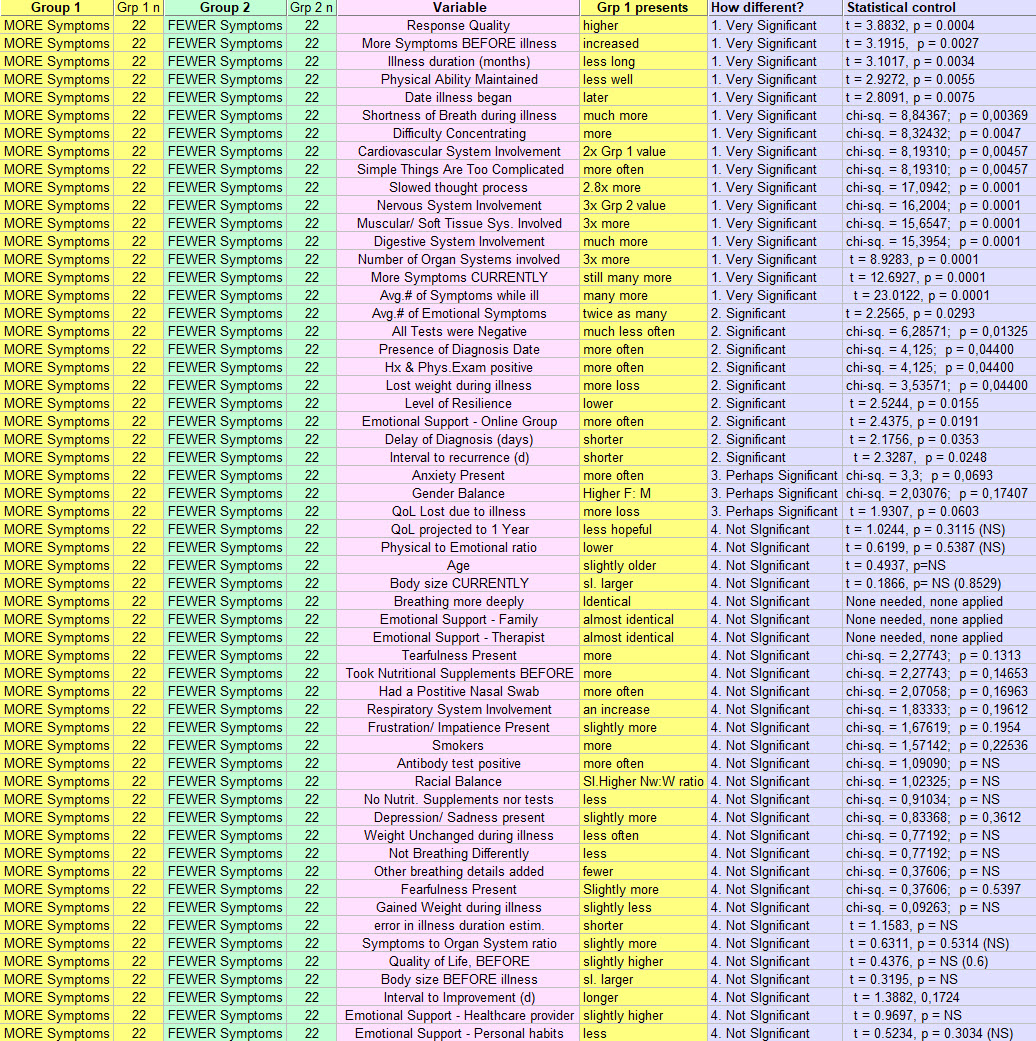
One notices fewer comparisons of the 57 variables, that identified no differences than in the last comparison above, but those are still the majority.
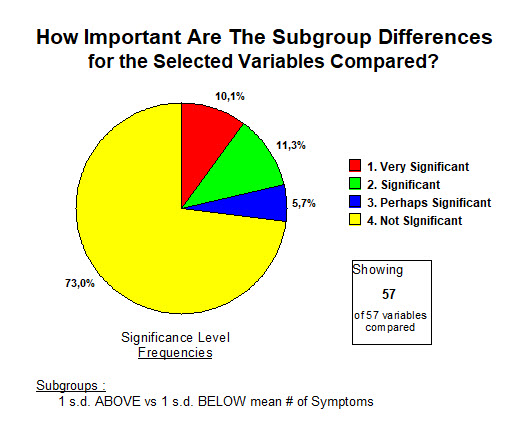
More than a quarter of the 57 variables are pointed to as important to focus on and explain if possible.
More symptoms (Grp 1) means :
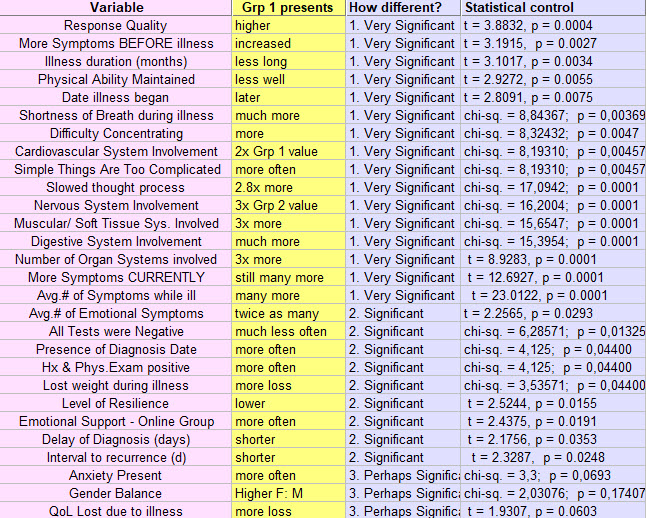
First of all, and perhaps surprising or not, a better performance on answering the questionnaire!
Well. We need more of these !
But more importantly, this longer list also equates with pretty rough sledding generally for those in this group.
One doesn't always need to have a huge number of symptoms to be quite ill.
For example, a 68 year old male who presents with one symptom: crushing substernal chest pain,
may already have all the symptoms he can handle.
But this result is simply confirming that more symptoms seem to clearly take a toll on the patient.
Above is essentially a description of a rather widespread disease.
And another point. Simply making up a long symptom list "for effect" when comunicating it, probably would not fit so well with the 28 variables brought together here.
Physicians tend to not like lists of patient problems that feature lots of symptoms.
Here, this above average number of symptoms group is probably relaying things as they are.
That risks proving to be a bad matchup of patient and provider.
Even worse, patients in this group 1 s.d. above the mean number of symptoms, have a picture of significant diffuse involvement working against them.
Perhaps their higher score on the questionnaire than that of those with many fewer symptoms, reflects a
a clear and straightforward message that needs to be heard.
----------
IN SUMMARY
Here are the results if one puts these 5 groups (or 10 subgroups) back together again ...
That provides 285 opportunities for comparison.
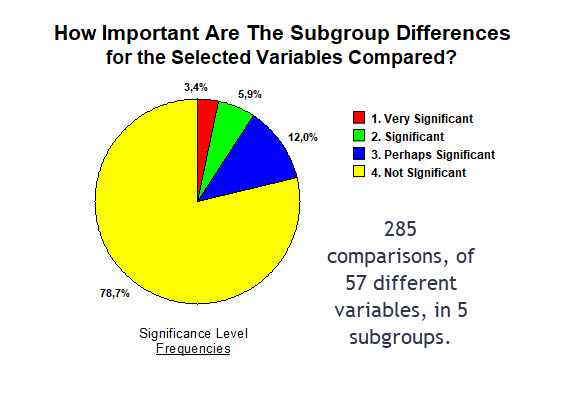
Looks very similar, doesn't it.
So the point remains that a unified view of the effect of this illness is indicated:
BAME and white, older and younger, men as well as women, more symptoms or fewer, fatigue starting before or not, ... are all in the same boat 79% of the time.
That does not mean they're enjoying the cruise.
Many have been in that lifeboat for 7 months now, ... awating rescue while pulling at the oars from time to time with what energy is left. A Medical 'Raft of the Medusa'.
Sometimes searching for differences leads to a bias. As though the conclusion becomes, and not at all supported as we saw, that these respondents are all different. That each is individually living an illness different from their "long-term" COVID-19 neighbor. Well they are not.
Having said that, if we put all these 10 paired subgroups back together, what happens at the top of that list sorted by signficance ?
Here we've limited the discussion to SIgnificance Level 1, Very Significant differences.
We've also added on the left a column with the "Comparison Name."
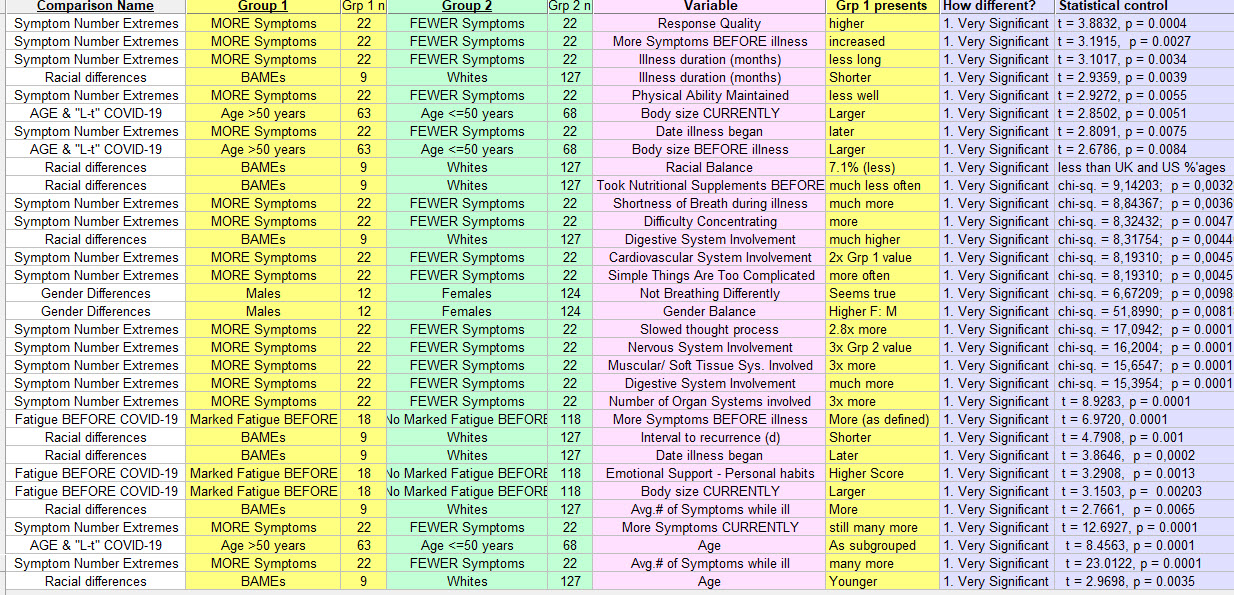
The position at the top of this list of the "1. Very Significant" seems have been taken over primarily by two groups: those with many more symptoms, and the BAME group.
So looking for and finding these differences through such comparisons can in fact shed light as well as heat. ("Heat" in this case, is moving around and ahead at times, but without much progress. "Light" is, well we'll see here in just a bit ).
-----------
POST SCRIPTUM
Before moving on, one more point to emphasize.
Shown below, data from the 5 groups just discussed. Representing 285 comparisons of variables pertinent to the "long-term" COVID-19 illness.
Before splitting these into their groups (here reassembled), how close to normal were the results for these variables overall?
Imagine looking at your lab report from your last blood test. Unless you're in the midst of a health catastrophe, maybe some results a bit above those in the laboratory normal values column, and maybe some a bit below.
But often reassuring.
That is not the case here.
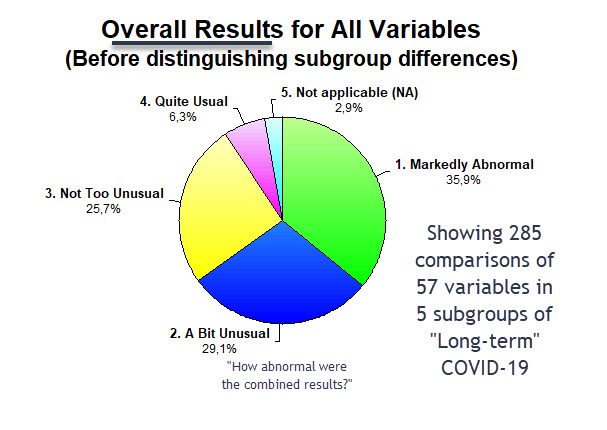
Essentially 75% of these variables have results that are markedly abnormal, varying to at least "a bit unusual."
So before getting lost in subtle statistical differences, one should interpret this overall result as being in the category of a health catastrophe in the making. Already well settled into place in fact, but continuing.
To view it otherwise is to place oneself seriously behind the "8"-ball in this game. And the virus knows its way pretty well around the table.
The advice given by respondents to healthcare providers is in general, good advice.
Some find the phrases there hard to swallow and start getting defensive. Not the right response.
Time to get a move on.
Time to think out of the box.
And no, it's not a game.
And no, the "long-haulers" are not all just a bit loony.
Then again, if you had it, you might just get a bit loony yourself.
-----------
At the top of this page I informed that the questionnaire's answers had generated 78 groups, each eager to present its results for the 57 variables of the questionnaire.
Here we've presented 5 of these 78 groups: age, race, gender, fatigue before, and many symptoms.
On a separate page, I have added a similar analysis of smokers vs. non-smokers.
And on another, a comparative analysis of Normal Body Size (BMI) vs. Abnormal. And the effects.
We'll let the other 71 groups quietly rest for now, and move on to other tasks, some waiting much less patiently.
----------
And here's a teaser !
----------
Here responses were used to generate comparisons, finding differences that add to our understanding.
It is also possible to put together different questions & responses to see what emerges.
Here's one example:
Respiratory Alkalosis and Hypophosphatemia >>>>>
<<<<<<< Home
Comparing Smokers & Non-Smokers with "Long-term" COVID-19
LTCOVID.com
Thanks for visiting!
To translate this page, select your
language from the dropdown menu below:
As we add comparisons like this one, there are certain traps that may mislead our studied conclusions.
These always take place in a larger context. And as important, finding a difference, even if statistically significant, doesn't always explain it's cause. And finally, discovering that certain apparent differences as one glances at the results, are not significant after statistical control, can be equally important. It says: "for this variable, they are the same": very often useful. Often less exciting for a researcher.
So before looking for those "significant differences" that attract attention, what should one note about
Smokers and Non-Smokers in our sample of 136 respondents?
-
- They all present as having "long-term" COVID-19. So if smoking or not before becoming infected is important, here we can say that our entire sample of respondents presented as having the illness. 100% if we believe all respondents that they have it. That's the context.
- 54.81% of our total sample of 136 are Non-Smokers & 40% are Smokers. That does not add up to 100% because some preferred not to tell. But 61 total smokers, compared with 75 non-smokers should be enough to find important differences related to smoking if they are there.
- In the United States, 13.7% of the population smokes. In the United Kingdom, 14.7%. So a sample where 40% are Smokers, is already clearly different then the populations from which that sample was drawn. Conclusion: Smoking is clearly more associated with having COVID-19, or at least it's "long-term" variant. It says the equivalent of "if you smoke, prepare yourself to land in the "long-term" COVID-19 group if you become infected with the SARS-CoV-2 virus." That conclusion seems defensible.
Smoking or Not with "long-term" COVID-19 : Differences ?
In what follows: Grp 1 = Smokers; Grp 2 = Non-smokers
Here is their long list.
57 variables compared, and reported here sorted by calculated levels of significance.
You will quickly notice that
- most differences did not prove to be statistically significant. (51 of 57)
- no differences calculated to a result of "1. Very SIgnificant"
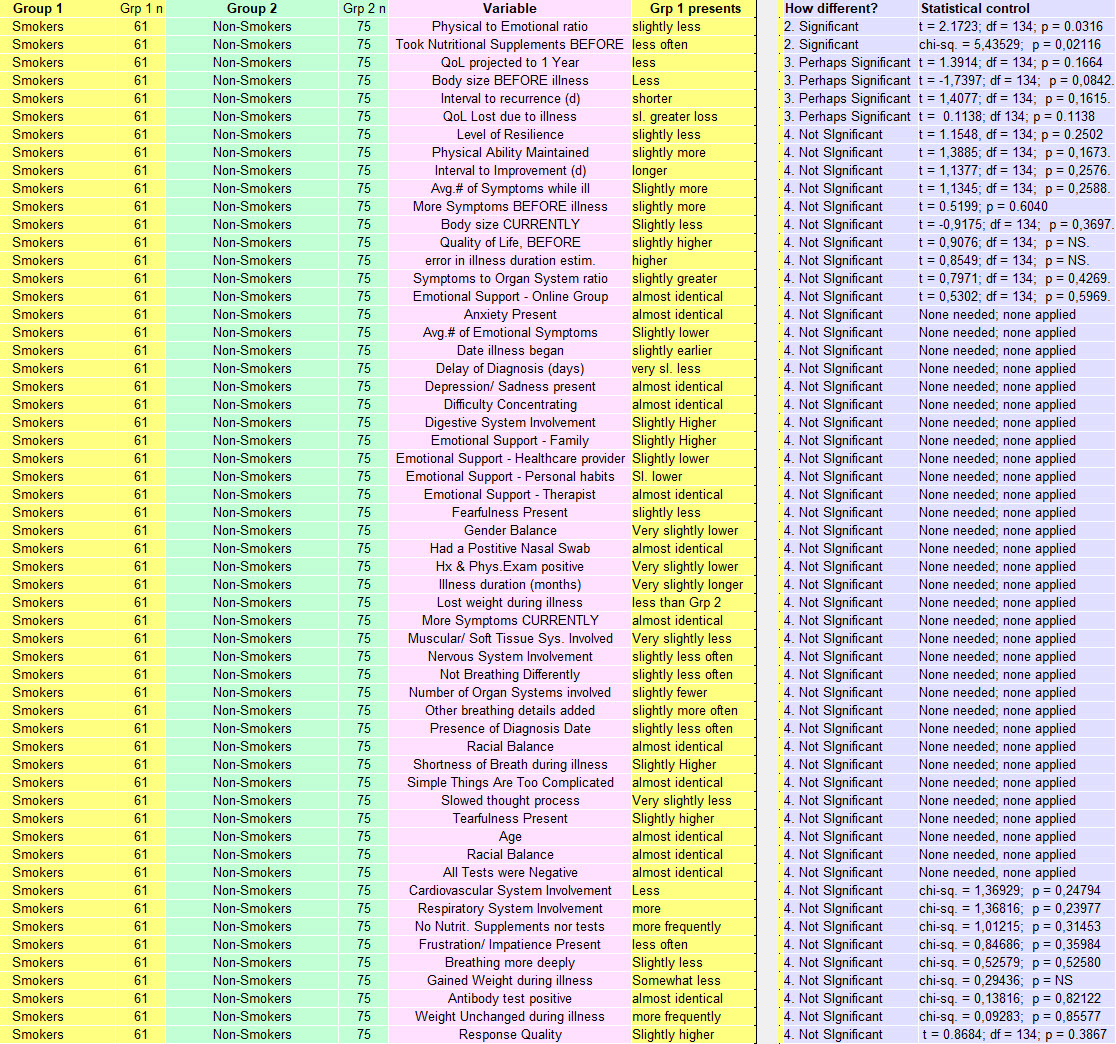
Only 6 differences pass muster under statistical control. Of these 4 belong to the category of
"3. Perhaps Significant."
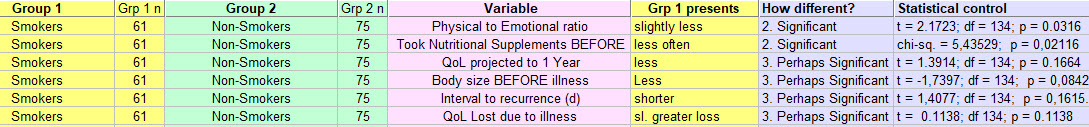
Let's make these easier to read ...
(You can click on the image and it will enlarge).
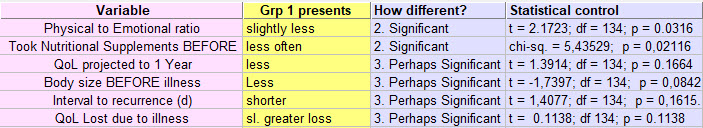
And ?
- Smokers find that their "long-term" COVID-19 illness is slightly less Physical, but more Emotional.
- They took nutritional supplments, or obtained tests related to levels of things like Vitamin-D, less often than the Non-smokers.
- Smokers projected a return of Quality of Life in 1 Year, that is less than Non-smokers. Not a large difference, but suggests a little less hope for the future among the Smokers.
- Smokers had a smaller body size (BMI) before illness began than the Non-smokers. Overall, the entire group (136) of respondents was on average overweight. Based on figures from the populations from which they were drawn. They are not alone faing issues of weight.
- For those who became ill, who had experienced feeling better, then feeling worse again which we'll call a recurrence, that recurrence arrived sooner in the Smokers. A p-value of 0.1615 means some will dismiss this difference as not significant. It may nevertheless be trying to teach us something about the potential association of this disease and its recuurence, with smoking.
- The Quality of Life lost during the illness, and due to the illness, was seen as slightly greater among Smokers.
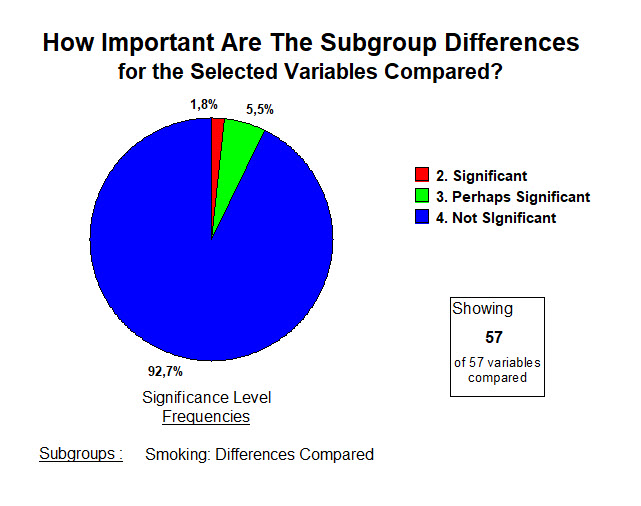
So what are the overall frequencies of significance for the differences between Smokers and Non-Smokers, 2 subgroups of the larger sample of respondents presenting with "long-term" COVID-19?
Glad you asked. They look like this ...
"So why even bother with this comparison?" - some might ask.
Just for the sake of emphasis, I repeat here that results that are mathematically "4. Not Significant" may still be of value. May still teach us something important.
Here's 1 example, the variable "Difficulty Concentrating" :
-
-
- 83.6% of our Smoking respondents had selected this suggested responce.
- 85.3% of Non-smokers selected that variable as present in their lives due to this illness.
- Very little difference, and not statistically significant.
- If one had a study with 10 000 respondents, such a difference might become significant or "a real difference." If that were the case, smoking would seem to prevent "Difficulty Concentrating." A ridiculous suggestion, but we don't have those data yet! Sometimes such larger studies, by identifying and emphasizing miniscule differences, miss the obvious. They can lead horribly astray. That's a forest versus trees situation.
- More to the point: Independent of whether they smoke or not, more than 80% of individuals presenting through our questionnaire with the "long-term" variant of COVID-19 have "Difficulty Concentrating." Why?
-
"Difficulty Concentrating" might be an emotional problem. Hard to concentrate when one is Anxious, Fearful, Frustrated and Impatient, as many of our respondents indicated being. So it probably has, this concentration problem, an emotional component.
Of course, a Neurologic cause for "Difficulty Concentrating" is strongly supported as wall.
Smokers and Non-smokers both, indicated that their Nervous System was affected. 67.2% for the Smokers, and 73.3% for the Non-smokers. And as said, that difference did not reach significance mathematically.
But autopsy studies conducted by Pathologists of brains infected by SARS-CoV-2 support our respondents' opinions: their impressions that their brains (even without a brain biopsy), are not quite right just yet.
So it's likely to be: both Physical and Emotional.
A result of "4. No Significant Difference" just attracted our attention to that.
So concentrate on that for just a moment.
-------
A parting word or two.
If we put the Smokers and Non-Smokers back together again (not in the same room please. Second-hand smoke would convert them all to Smokers), just how abnormal are the results?
Overall, for each of these 57 variables studied, how out of the ordinary are these problems under study?
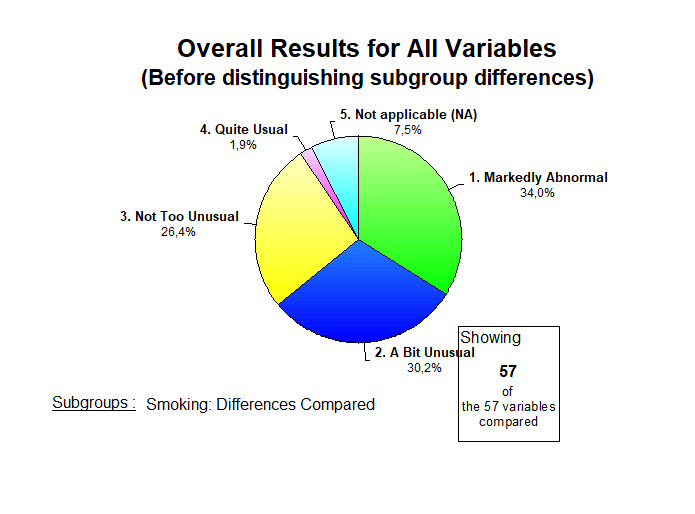
So almost 3/4's of the Smoker/ Non-smoker respondents are faced with results that vary from "Markedly Abnormal" (34%) to at least, "A Bit Unusual" (30%).
What other results are we waiting for, to try to bring this illness to an end?
Enough Is Enough.
The Energetics of all of this >>>>>>>
<<<< Show me Other Comparisons
<<<<<<< Home
A Comparison: Differences in "long-term" COVID-19 linked to Body Size
LTCOVID.com
Thanks for visiting!
To translate this page, select your
language from the dropdown menu below:
DIFFERENCES LINKED TO BODY SIZE
Group 1 = Respondents whose BMI was normal and did not change during this illness.
Group 2 = Respondents whose BMI was abnormal and remained so during this illness.
Why study this?
Because during many illnesses, one's size before the illness began, one's Body Mass Index (BMI),
is known to have an impact on multiple aspects of outcome from the disease.
There is a learned tendency towards jumping on the "obesity is bad" bandwagon.
And for COVID-19, much in the literature suggests that pre-illness obesity is a risk factor.
Not only for acquiring the SARS-CoV-2 more easily (increased infection rate after transmission of the virus), but also for having a more difficult time with the illness and a worse outcome, as defined in several different ways.
All true, and we won't be making an argument to refute those.
But there is an important addition to be made.
Normal size (BMI) seems to be protective if one is going to get sick.
True for almost all illnesses, infectious and others.
Most of us don't plan to get sick. Perhaps we should a bit more: a committment to "wellness."
So those who are underweight, and several of our respondents were, are also at risk of having a
worse time with COVID-19.
In fact, results related to extremes of body size and untoward effects during acquired illness,
usually take on a "U"-shaped results curve like the one below:
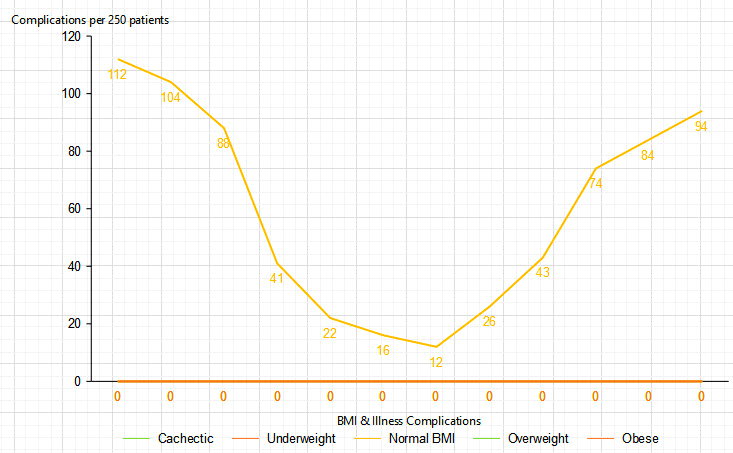
So knowing that, a decision was taken to compare those respondents to our questionnaire who were and remained of normal size during "long-term" COVID-19 (Group 1 below), with all those who were not (Group 2).
So those who were underweight based on height and weight calculations of BMI, and all those at the other end of the spectrum, where that calculated to overweight or obese, were lumped together.
That doesn't have to be a permanent arrangement from a data analysis point of view, but makes a start.
---------
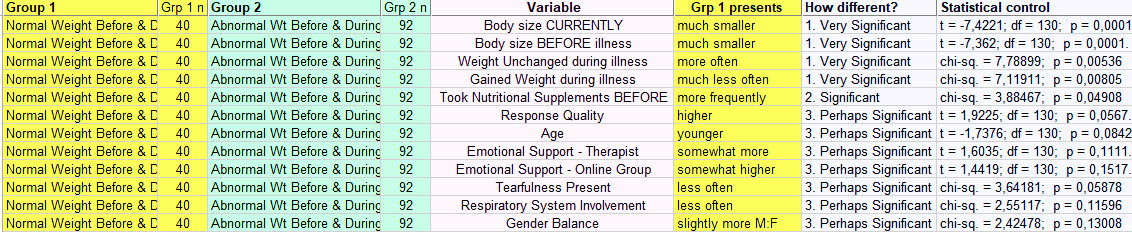
Here is their long list :
58 variables compared, and coming of course from the responses to the questionnaire.
Grp 1 - Normal BMI, Before and During illness; Grp 2 - Abnormal BMI, Before and During illness.
- It has been sorted top to bottom by level of statistical significance of the differences observed. (Grey column on right). You'll get to see this better below.
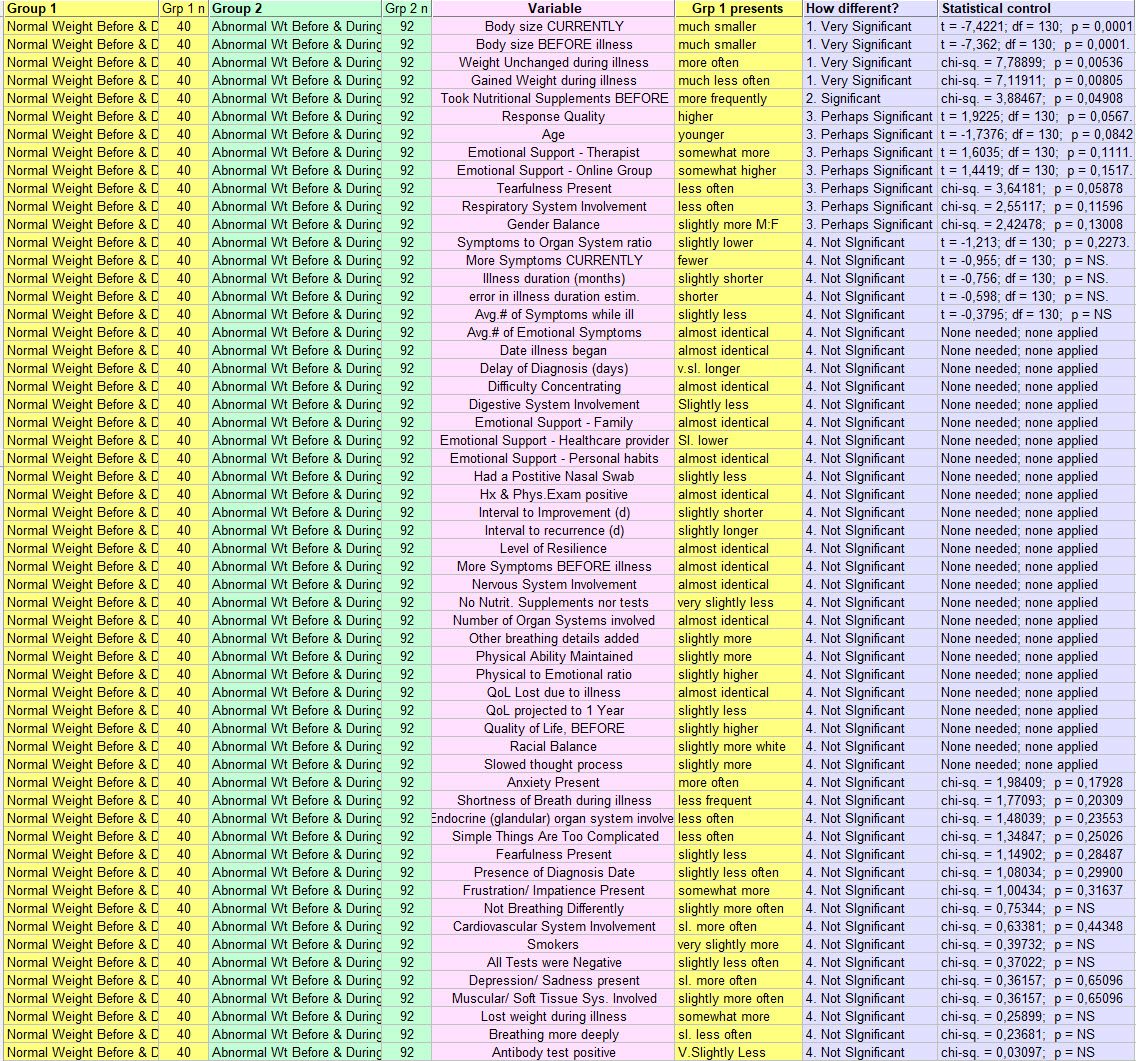
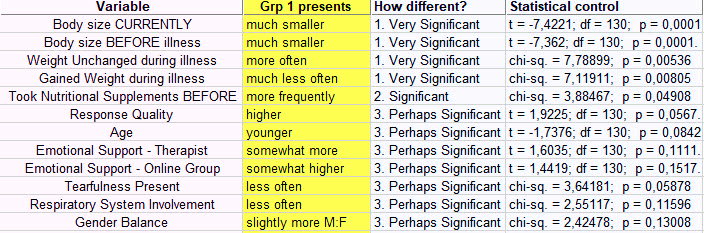
So next this, to help focus on those that are more significant ...
(I suggest clicking the image to enlarge it).
And better seen here:
(Just remember that Grp 1 = Normal Weight Before and During Illness. Click image as needed).
What did we learn ?
- First to put this in perspective, all of the respondents (of all sizes) took the questionnaire because they presented with the signs and symptoms of "long-term" COVID-19.
- So any differences between the two grooups, collected in the images above, also help to define the overall larger group with this illness. In other words, none of these 58 variables studied, kept them from getting "long-term" COVID-19.
- The first to "Very Significant" results got that result because we selected them to be different! Here comparing Normal and Abnormal size groups, so they are ! And yet, knowing that tthe size difference that appeared during analysis confirms that they really are separate groups. 1 chance in 10 000 that is not the case.
- Some respondents during this illness gained weight. Our "Normal BMI" Grp 1 did not. And their weight remained unchanged more often.
- Those with "Normal BMI" took Nutritional Supplements and had tests done related to those supplements (like Vitamin-D) more often.
Next on the list we move down to results that were class III - "3. Perhaps Significant." These didn't meet that famous "p < 0.05" value. But they are close enough that we should let them keep our attention for just a bit.
- The quality of responses to the questionnaire score higher in Grp 1, than Grp 2. Are we into character traits here? Perhaps. Are those who usually maintain a normal weight, also a bit more fastidious than those who don't ? The statistics (p=0.0567) say that that is proabably true. You decide.
- Age: Grp 1 was probably significantly younger. (p=0.08)
- Therapy: Group one turned towards a Therapist more often than Grp 2 for effective emotional support of this illness, with its demonstrated emotional components.
- Online Group effecitiveness: Grp 1 gave higher scores. We did not do a multifactorial analysis to see if this was because they were younger.
- Tearfulness: Grp 1 was less often tearful. (p=0.0588). So we are saying through this response that those with Abnormal Weights (specifically BMI) manifest more often a classic sign of depression.
- Respiratory System Involvement : less often in Grp 1. (p=0.116). Now we may be on to something. Maintain usually a normal weight/ size, and if you (unfortunately) get this COVID-19 illness, you will probably have fewer respiratory problems than those (Grp 2) who tipped the scales a bit, including either below or above normal.
- Finally, those in Grp 1, normal size before and during illness, were more often male gender. Overall, lewer than 10% of respondents were men. But here we add to the other gentle positive differences, that they were male. A real statistician will counter: "Your p-value of 0.13008 is not significant." Okay. Perhaps the next time we do the questionnaire and we get 10 000 respondents, it will be a real difference.
Can we compile these into an imagined respondent who's weight was normal before and remained so?
He may be a man. Not only did he not gain weight during this illness, he was slightly younger, saw a therapist more often for the emotional difficulties brought on by this disease. Perhaps why he was ess odten tearful. He also found online groups devoted to this illness, effective. He had fewer breathing problems, with less involvement of his Respiraotyr System. And last but not least, he devoted enough attention to our questionnaire to get a high quality sxore assigned to his responses.
Those who are not in his Group 1, may not appreciate these innuendoes.
Yet the statistics suggest that these are more than just insinuations.
They also fit the "U"-shaped graph above.
Maintain a healthy size, take a few supplements, seek a little help when things get to be too much, and you may have to live through fewer complications of illness and have a better outcome eventually from COVID-19.
But before we begin separating "long-haulers" into armed camps, here is what is more important.
How Many of These Perceived Differences Were Statistically Significant ?
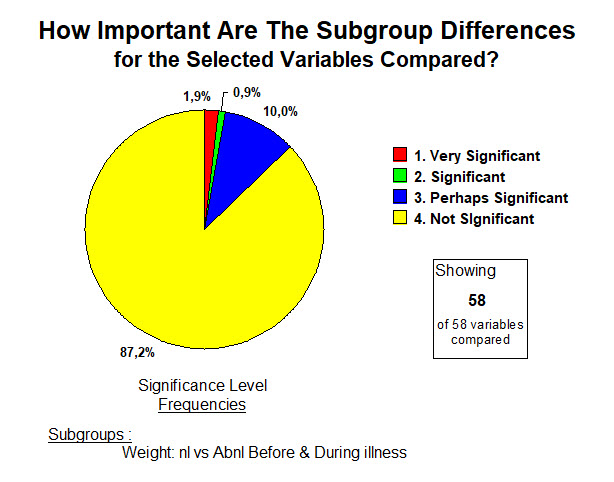
ANSWER : 87% were not. So of the 58 variables studied in those who were and maintained Normal BMI, compared with those who Were not/Did not, only 13% of the differences discovered passed statistical control.
So. "Just Forget The Whole Thing ?"
Hardly.
No not at all.
For each of these 58 variables, the results for the larger group of respondents before separating them into subgroups for study as we have just done, were usually quite abnormal. We are not looking for small and rare differences in a whole list of insignificant complaints.
It's not that at all.
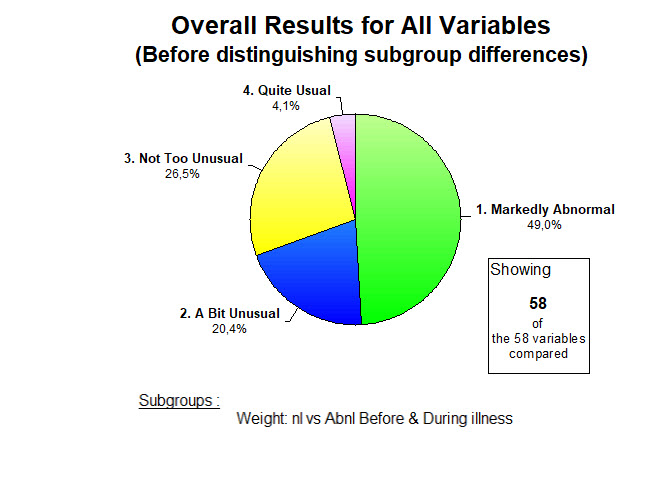
ANSWER: When judged by the usual and established Medical criteria, half of these 58 variables show results that are "1. Markedly Abnormal." Another 20% have results that are "2. A Bit Unusual."
So 70% of the multiple variables studied in "long-term" COVID-19 respondents are ABNORMAL.
Those who haven't yet digested that reality in body and mind, should delay no longer in doing so.
----------
Here responses were used to generate comparisons, finding differences that add to our understanding.
It is also possible to put together different questions to see what emerges.
Here's one example:
Respiratory Alkalosis and Hypophosphatemia >>>>>
And never forget ...
These analyses of responses to the questionnaire, are all pointing us at the same conclusion:
Energy can never be created nor destroyed, BUT, one can have serious problems with ENERGY SUPPLY.
We'll get to Energetics very soon on our journey together. But do read about Alkalosis & Hypophos.
<<<<<< Back to Other Comparisons
<<<<<<< Home