
Responses to the questionnaire: Summarized Data
LTCOVID.com
Thanks for visiting!
To translate this page, select your
language from the dropdown menu below:
For the sake of complete sharing of this information, the results as available from SurveyMonkey
where the questionnaire was hosted, are now offered here.
BUT DON'T FORGET !
Each question and its results, with comments, are already presented one at a time on this site.
In the menu at right, "Answers (Total Sample Results)" is a category. Click on that and you'll
be taken to the start of the one-by-one question analysis. To go there now, click this link.
---------
It's In PDF format, 87 pages.
One will quickly see that some questions seem to have no response data.
Those are the questions that required a personal answer, rather than making a choice from suggested answers. These responses have not been overlooked. They are summarized below.
Some of these written answers are also available for your review.
For example, the advice offered to others, also ill with the "long-term" variant of COVID-19.
Advice for those caring for the patient is also provided. Many are particularly poignant.
Quite important data, but read these only at your own risk. Especially if a physician.
Then again. If you are a provider of care, these messages are a 'must read'.
----------
These data are first presented below in an image gallery. These may be difficult to read, so see below for other options. You can click to view fullscreen, and once opened, click to close the vignettes, increasing image size even further.
Below are these same images, available for download.
You can right-click on an image to save it. 
Please remember to mention LTCOVID.com. Thanks.
Apply these however you can, towards healing this illness.
page 1

page 2
page 3

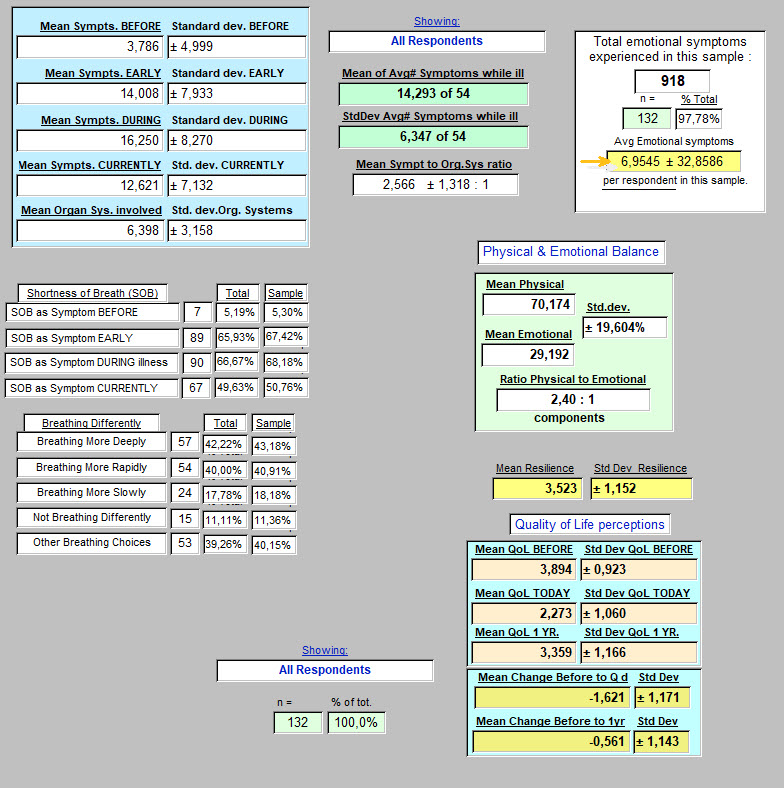
Responses were accumulated as means ± standard deviations where appropriate.
Often, this requires presenting numbers and percentages instead.
These results are presented here in PDF: Page 1, Page 2, Page 3, All 3 pages joined.
The same data, offered here as a 4 slide PowerPoint presentation.
To facilitate viewing these data, selected clips from the above pages are presented in order, in the gallery of images below.
These in a gallery cannot be saved with a right click of your mouse, but a screen capture should work fine.
These responses are offered free of charge because after all, they belong to our respondents.
You won't come upon them elsewhere in a pay-per-view "offer."
If you can find in them, a use to support your research or interest in "long-term" COVID-19, then we will
have been adequately repaid.
<<<<<< Home
<<<<<< Nov. 27 Presentation Information page
Next, >>>>>>> Grouped Data Comparisons
A découvrir aussi
- Answers to the Questionnaire
- Q. 13 - Usual (pre-illness) Number of Prescription Medications
- Q. 17 - Medications are taken based on which sources of information?