
A Comparison: Differences in "long-term" COVID-19 linked to Body Size
LTCOVID.com
Thanks for visiting!
To translate this page, select your
language from the dropdown menu below:
DIFFERENCES LINKED TO BODY SIZE
Group 1 = Respondents whose BMI was normal and did not change during this illness.
Group 2 = Respondents whose BMI was abnormal and remained so during this illness.
Why study this?
Because during many illnesses, one's size before the illness began, one's Body Mass Index (BMI),
is known to have an impact on multiple aspects of outcome from the disease.
There is a learned tendency towards jumping on the "obesity is bad" bandwagon.
And for COVID-19, much in the literature suggests that pre-illness obesity is a risk factor.
Not only for acquiring the SARS-CoV-2 more easily (increased infection rate after transmission of the virus), but also for having a more difficult time with the illness and a worse outcome, as defined in several different ways.
All true, and we won't be making an argument to refute those.
But there is an important addition to be made.
Normal size (BMI) seems to be protective if one is going to get sick.
True for almost all illnesses, infectious and others.
Most of us don't plan to get sick. Perhaps we should a bit more: a committment to "wellness."
So those who are underweight, and several of our respondents were, are also at risk of having a
worse time with COVID-19.
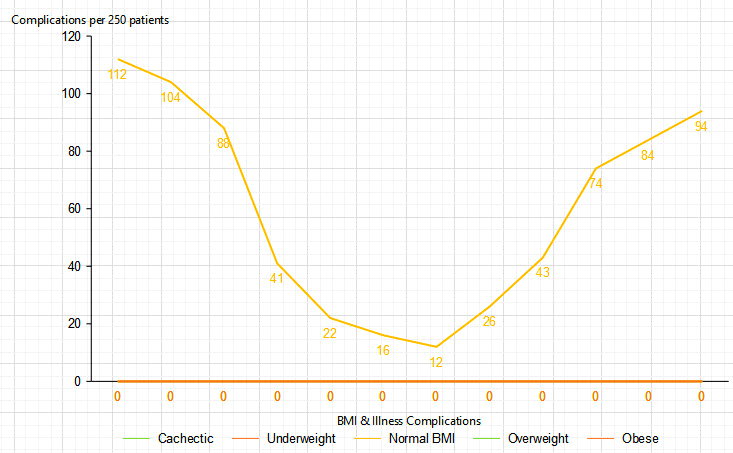
In fact, results related to extremes of body size and untoward effects during acquired illness,
usually take on a "U"-shaped results curve like the one below:
So knowing that, a decision was taken to compare those respondents to our questionnaire who were and remained of normal size during "long-term" COVID-19 (Group 1 below), with all those who were not (Group 2).
So those who were underweight based on height and weight calculations of BMI, and all those at the other end of the spectrum, where that calculated to overweight or obese, were lumped together.
That doesn't have to be a permanent arrangement from a data analysis point of view, but makes a start.
---------
Here is their long list :
58 variables compared, and coming of course from the responses to the questionnaire.
Grp 1 - Normal BMI, Before and During illness; Grp 2 - Abnormal BMI, Before and During illness.
- It has been sorted top to bottom by level of statistical significance of the differences observed. (Grey column on right). You'll get to see this better below.
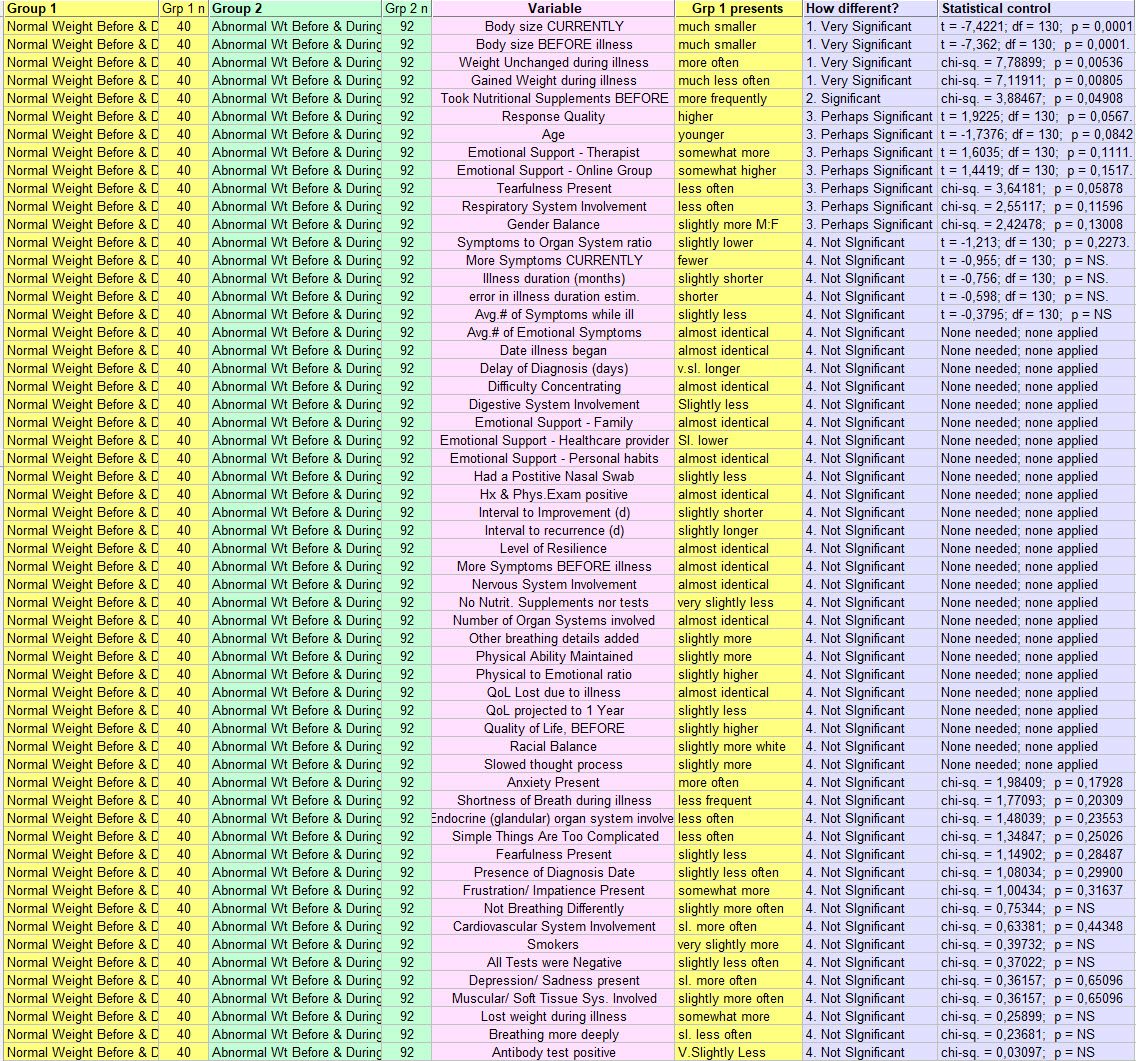
So next this, to help focus on those that are more significant ...
(I suggest clicking the image to enlarge it).
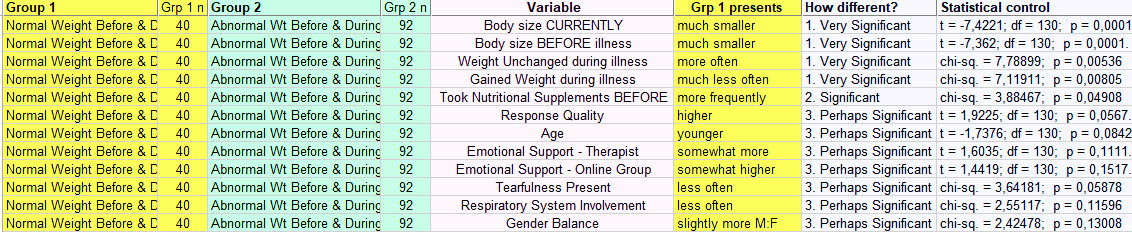
And better seen here:
(Just remember that Grp 1 = Normal Weight Before and During Illness. Click image as needed).
What did we learn ?
- First to put this in perspective, all of the respondents (of all sizes) took the questionnaire because they presented with the signs and symptoms of "long-term" COVID-19.
- So any differences between the two grooups, collected in the images above, also help to define the overall larger group with this illness. In other words, none of these 58 variables studied, kept them from getting "long-term" COVID-19.
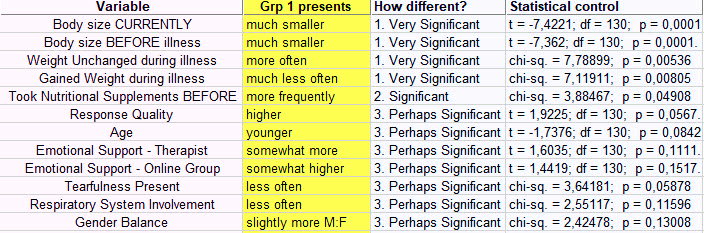
- The first to "Very Significant" results got that result because we selected them to be different! Here comparing Normal and Abnormal size groups, so they are ! And yet, knowing that tthe size difference that appeared during analysis confirms that they really are separate groups. 1 chance in 10 000 that is not the case.
- Some respondents during this illness gained weight. Our "Normal BMI" Grp 1 did not. And their weight remained unchanged more often.
- Those with "Normal BMI" took Nutritional Supplements and had tests done related to those supplements (like Vitamin-D) more often.
Next on the list we move down to results that were class III - "3. Perhaps Significant." These didn't meet that famous "p < 0.05" value. But they are close enough that we should let them keep our attention for just a bit.
- The quality of responses to the questionnaire score higher in Grp 1, than Grp 2. Are we into character traits here? Perhaps. Are those who usually maintain a normal weight, also a bit more fastidious than those who don't ? The statistics (p=0.0567) say that that is proabably true. You decide.
- Age: Grp 1 was probably significantly younger. (p=0.08)
- Therapy: Group one turned towards a Therapist more often than Grp 2 for effective emotional support of this illness, with its demonstrated emotional components.
- Online Group effecitiveness: Grp 1 gave higher scores. We did not do a multifactorial analysis to see if this was because they were younger.
- Tearfulness: Grp 1 was less often tearful. (p=0.0588). So we are saying through this response that those with Abnormal Weights (specifically BMI) manifest more often a classic sign of depression.
- Respiratory System Involvement : less often in Grp 1. (p=0.116). Now we may be on to something. Maintain usually a normal weight/ size, and if you (unfortunately) get this COVID-19 illness, you will probably have fewer respiratory problems than those (Grp 2) who tipped the scales a bit, including either below or above normal.
- Finally, those in Grp 1, normal size before and during illness, were more often male gender. Overall, lewer than 10% of respondents were men. But here we add to the other gentle positive differences, that they were male. A real statistician will counter: "Your p-value of 0.13008 is not significant." Okay. Perhaps the next time we do the questionnaire and we get 10 000 respondents, it will be a real difference.
Can we compile these into an imagined respondent who's weight was normal before and remained so?
He may be a man. Not only did he not gain weight during this illness, he was slightly younger, saw a therapist more often for the emotional difficulties brought on by this disease. Perhaps why he was ess odten tearful. He also found online groups devoted to this illness, effective. He had fewer breathing problems, with less involvement of his Respiraotyr System. And last but not least, he devoted enough attention to our questionnaire to get a high quality sxore assigned to his responses.
Those who are not in his Group 1, may not appreciate these innuendoes.
Yet the statistics suggest that these are more than just insinuations.
They also fit the "U"-shaped graph above.
Maintain a healthy size, take a few supplements, seek a little help when things get to be too much, and you may have to live through fewer complications of illness and have a better outcome eventually from COVID-19.
But before we begin separating "long-haulers" into armed camps, here is what is more important.
How Many of These Perceived Differences Were Statistically Significant ?
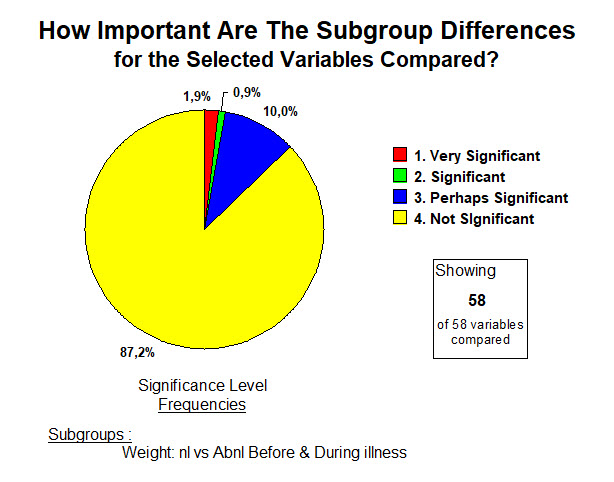
ANSWER : 87% were not. So of the 58 variables studied in those who were and maintained Normal BMI, compared with those who Were not/Did not, only 13% of the differences discovered passed statistical control.
So. "Just Forget The Whole Thing ?"
Hardly.
No not at all.
For each of these 58 variables, the results for the larger group of respondents before separating them into subgroups for study as we have just done, were usually quite abnormal. We are not looking for small and rare differences in a whole list of insignificant complaints.
It's not that at all.
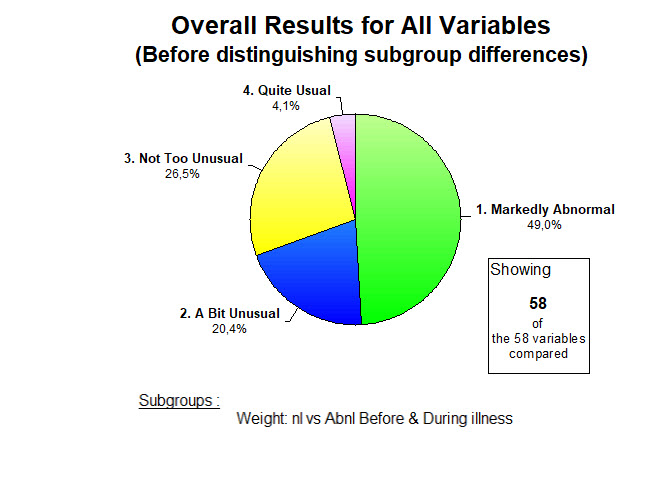
ANSWER: When judged by the usual and established Medical criteria, half of these 58 variables show results that are "1. Markedly Abnormal." Another 20% have results that are "2. A Bit Unusual."
So 70% of the multiple variables studied in "long-term" COVID-19 respondents are ABNORMAL.
Those who haven't yet digested that reality in body and mind, should delay no longer in doing so.
----------
Here responses were used to generate comparisons, finding differences that add to our understanding.
It is also possible to put together different questions to see what emerges.
Here's one example:
Respiratory Alkalosis and Hypophosphatemia >>>>>
And never forget ...
These analyses of responses to the questionnaire, are all pointing us at the same conclusion:
Energy can never be created nor destroyed, BUT, one can have serious problems with ENERGY SUPPLY.
We'll get to Energetics very soon on our journey together. But do read about Alkalosis & Hypophos.
<<<<<< Back to Other Comparisons
<<<<<<< Home